
The (In)accessible Housing Crisis
in Louisville, KY
The first-ever analysis of accessible
housing demand and the
failure of supply in Louisville.
Disabling Infrastructures: Louisville’s Accessible Housing Gap
“Disability” typically refers to a problem or deficit with an individual. [Todd – how upload the hello-imperfect font to possibly use to highlight parts of text? Might not be worth it.]
Let’s think about “disability” differently. “Disablement” results from the particular environment in which we find ourselves.
Wheelchair users are made “unable” by stairs, narrow doorways, broken sidewalks, and outdated attitudes. These are disabling infrastructures.
The lack of accessible housing is not merely an inconvenience. It is a crisis with public health implications and measurable consequences for tens of thousands of Louisville residents.
On this page, you will find data, testimony, images, and analysis meant to move you and inspire you to imagine a better way.
Housing infrastructure is fixable. Here’s why we need to do it:
Maybe put the buttons here???????????????????? Or another image??
Louisville faces a profound and growing accessible housing gap.
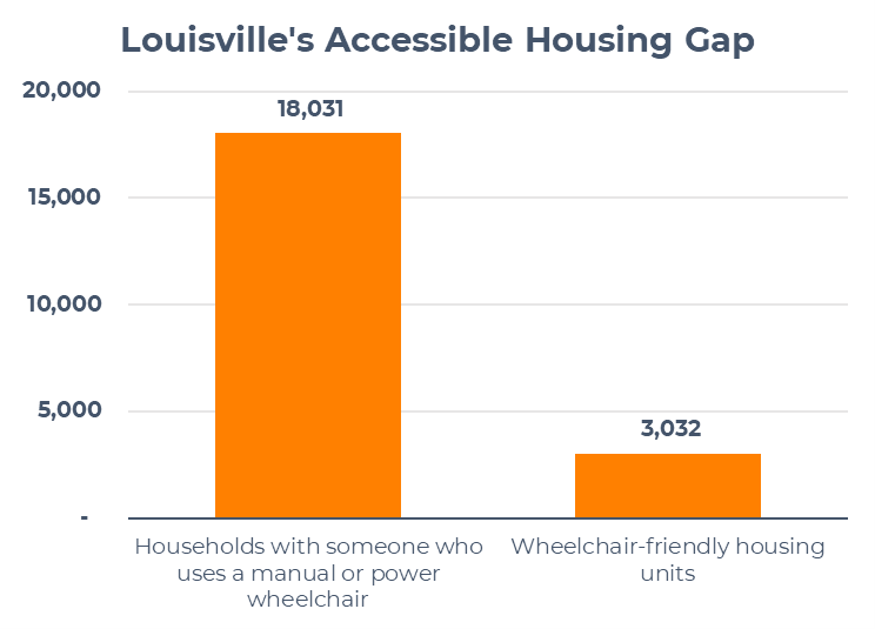
Of the city’s approximately 333,000 housing units, only around 3,000 are wheelchair-accessible,
Yet, there are an estimated 18,000 households with a wheelchair user, which means:
6 households compete for every one accessible unit.

The affordable accessible housing shortage is significant, even if harder to quantify. What we know with confidence is the supply.
Louisville has only 586 affordable accessible multifamily units available to people of any age living on low incomes, compared to roughly 9,000 Louisvillians under age 65 with “ambulatory difficulties” living in poverty.
and only 1,122 accessible Section 202 units reserved for low-income seniors, and approximately 8,300 seniors aged 65+ with “ambulatory difficulties” living in poverty.
Against any reasonable estimate of need, the number of affordable accessible units is inadequate.
The Accessible Housing Gap is Growing and Should Matter to Everyone
Each one of us is only one car accident, one slip-and-fall, one faulty blood vessel away from becoming a person with a disability.
And if we live long enough, accessibility will matter because disability skyrockets with age.
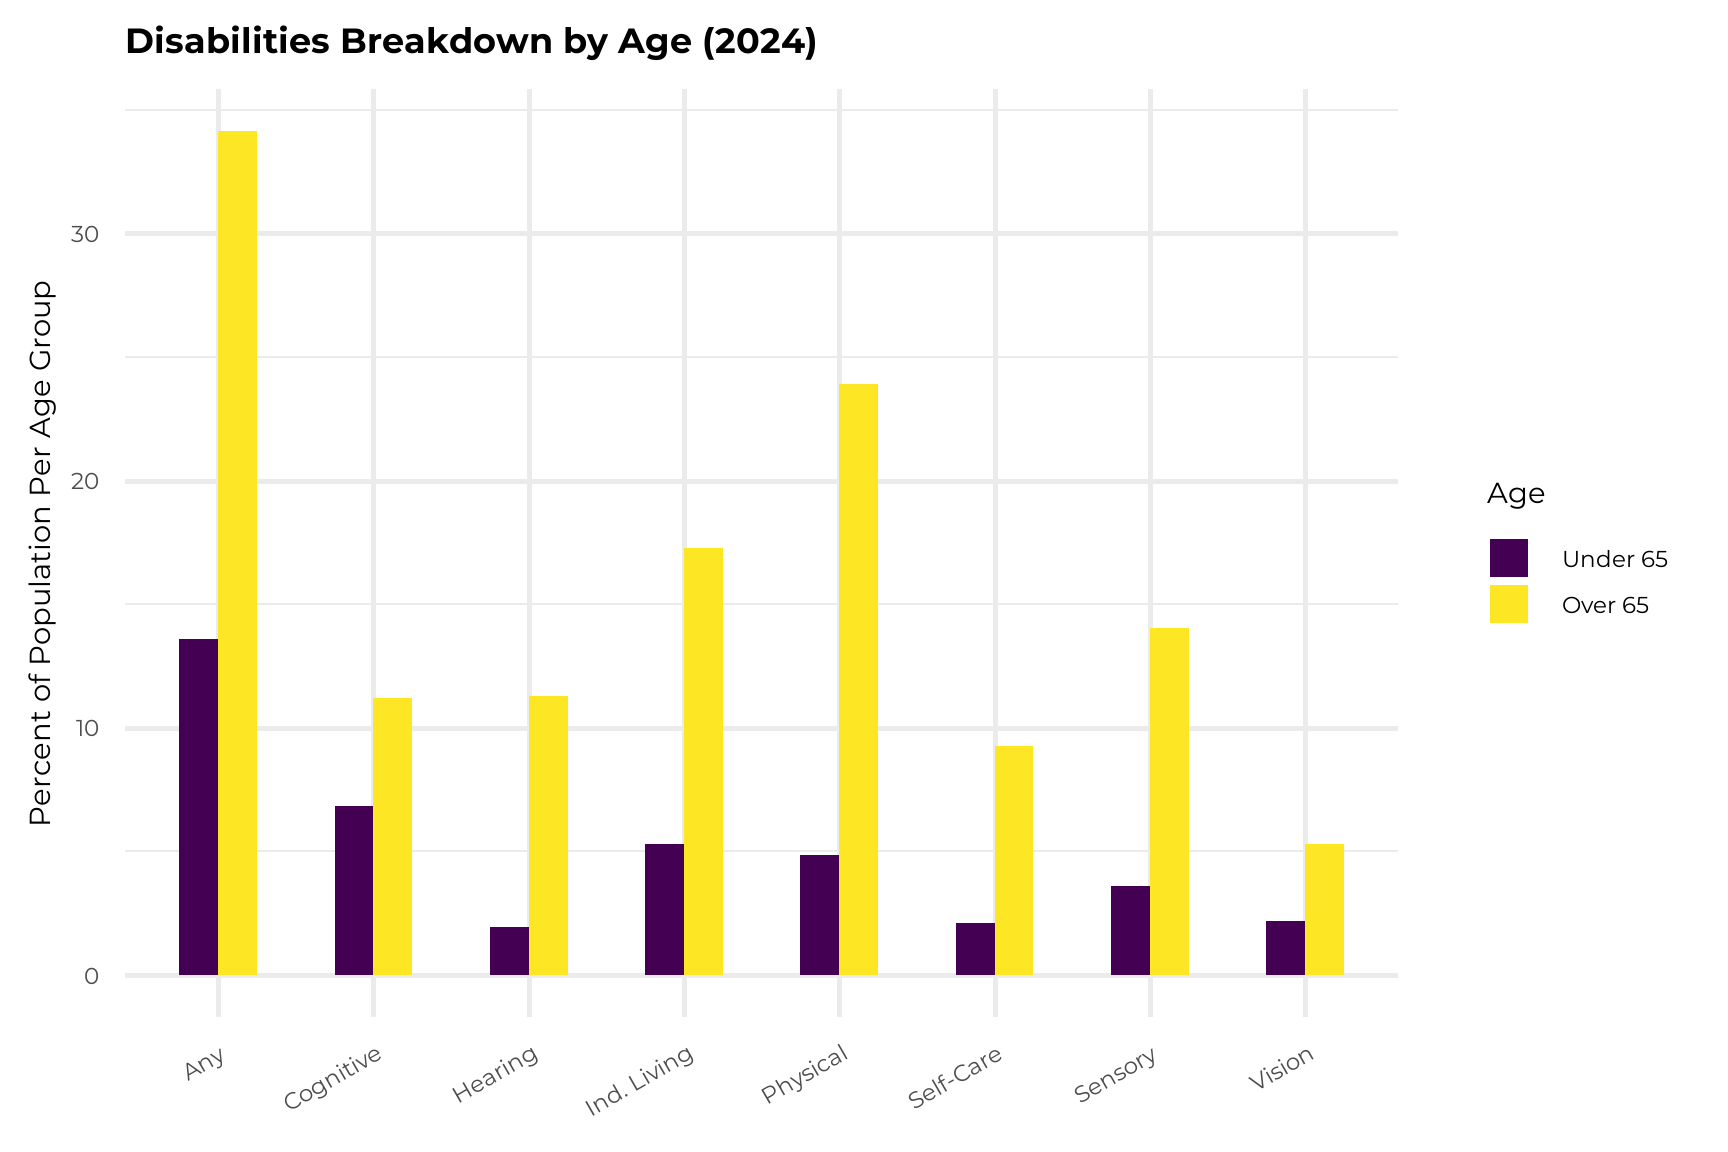
In Louisville, adults aged 65 or older are 5 times more likely to have a physical disability than those under age 65.
Download the report for more data on age and disability.
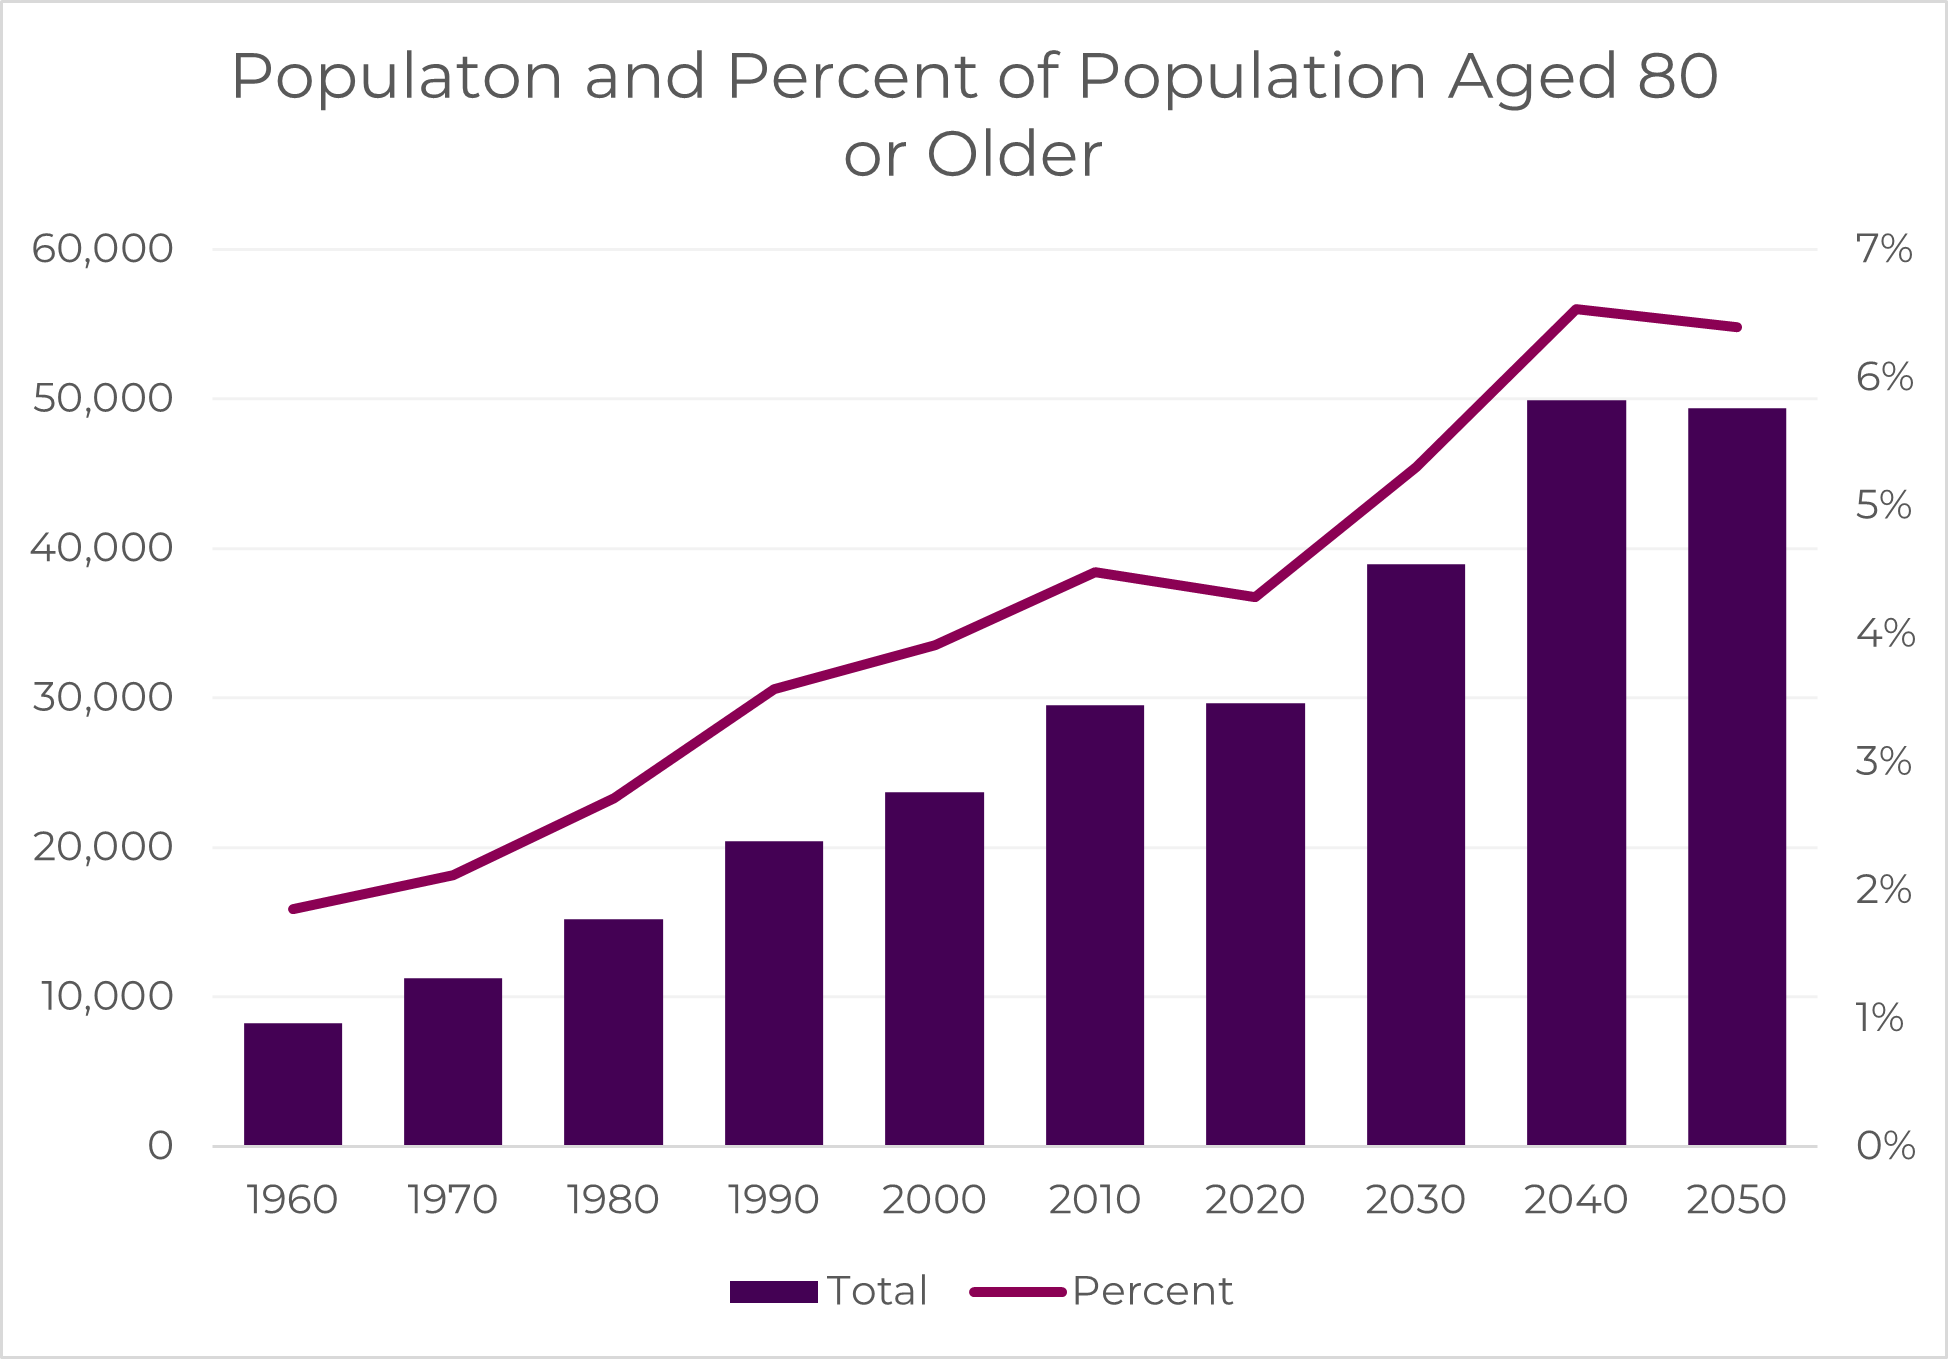
The accessible housing gap is growing as Louisville’s population ages.
44% of people 80+ have a physical disability.
By 2050, the 80+ population will grow by 19,000
Download the report for more information on age and disability projections.
The Impact of (In)accessible Housing

Kaelin

Graham
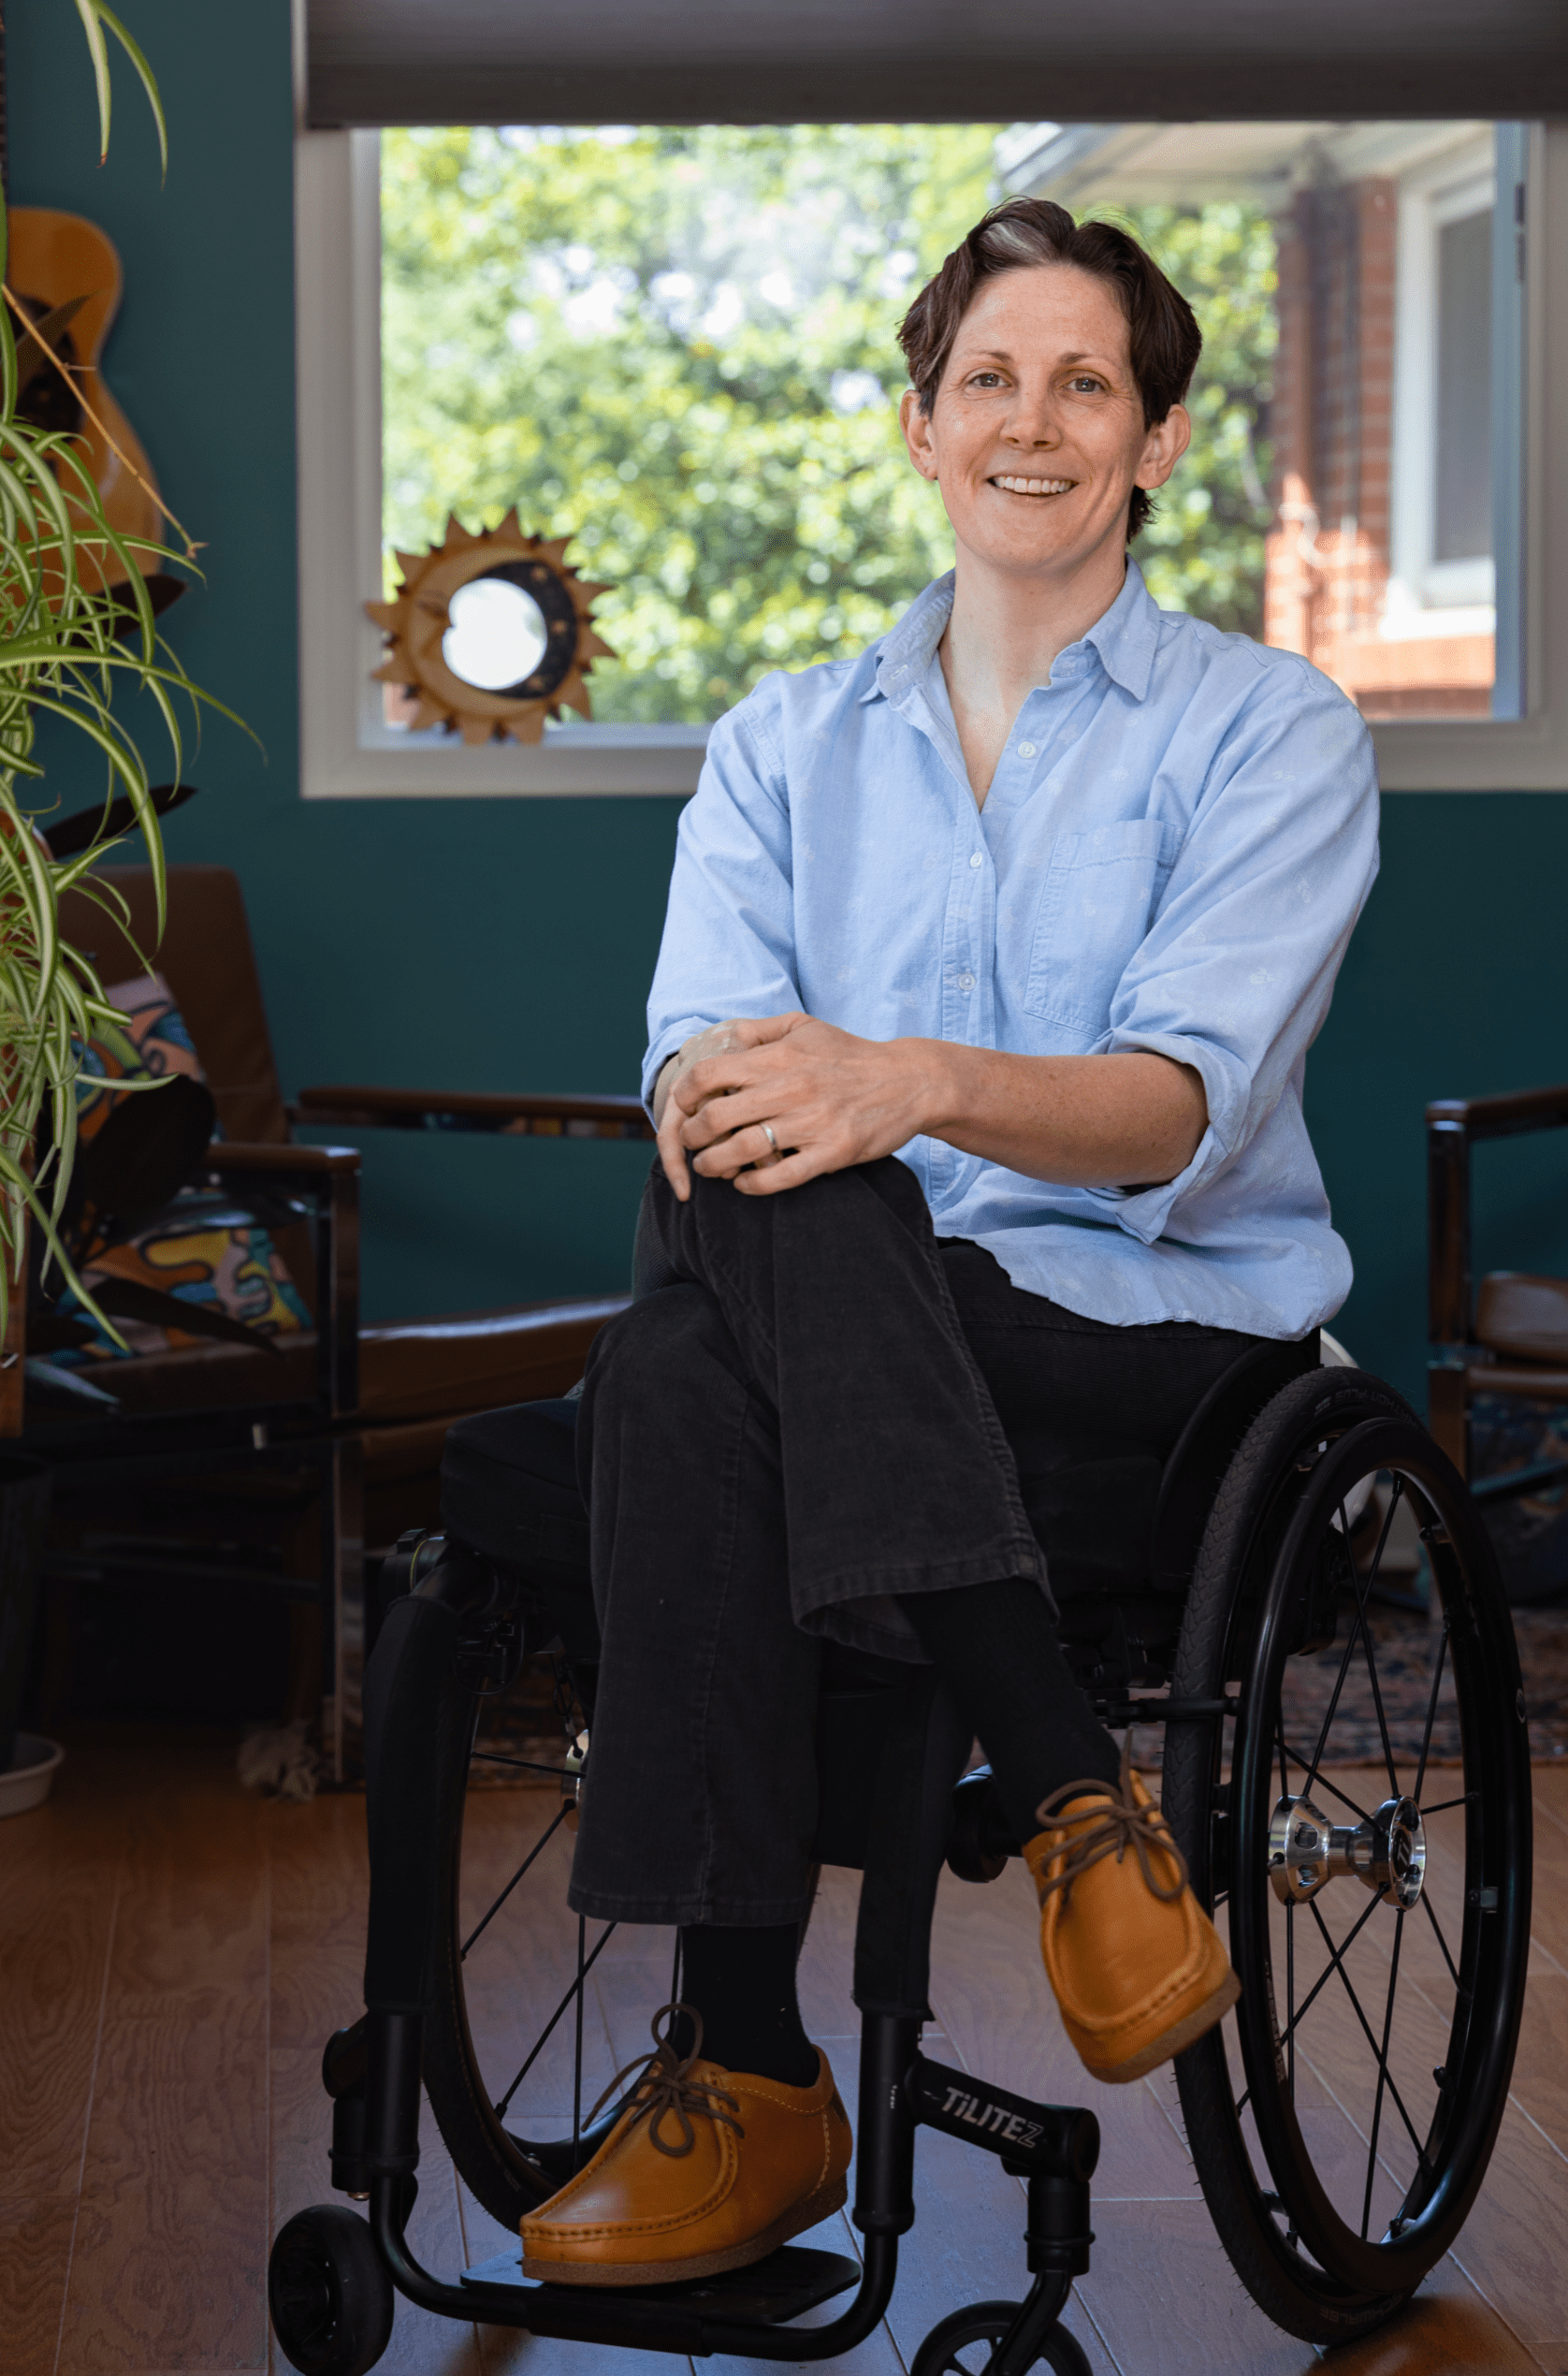
Rachel
Terrell
Garrison
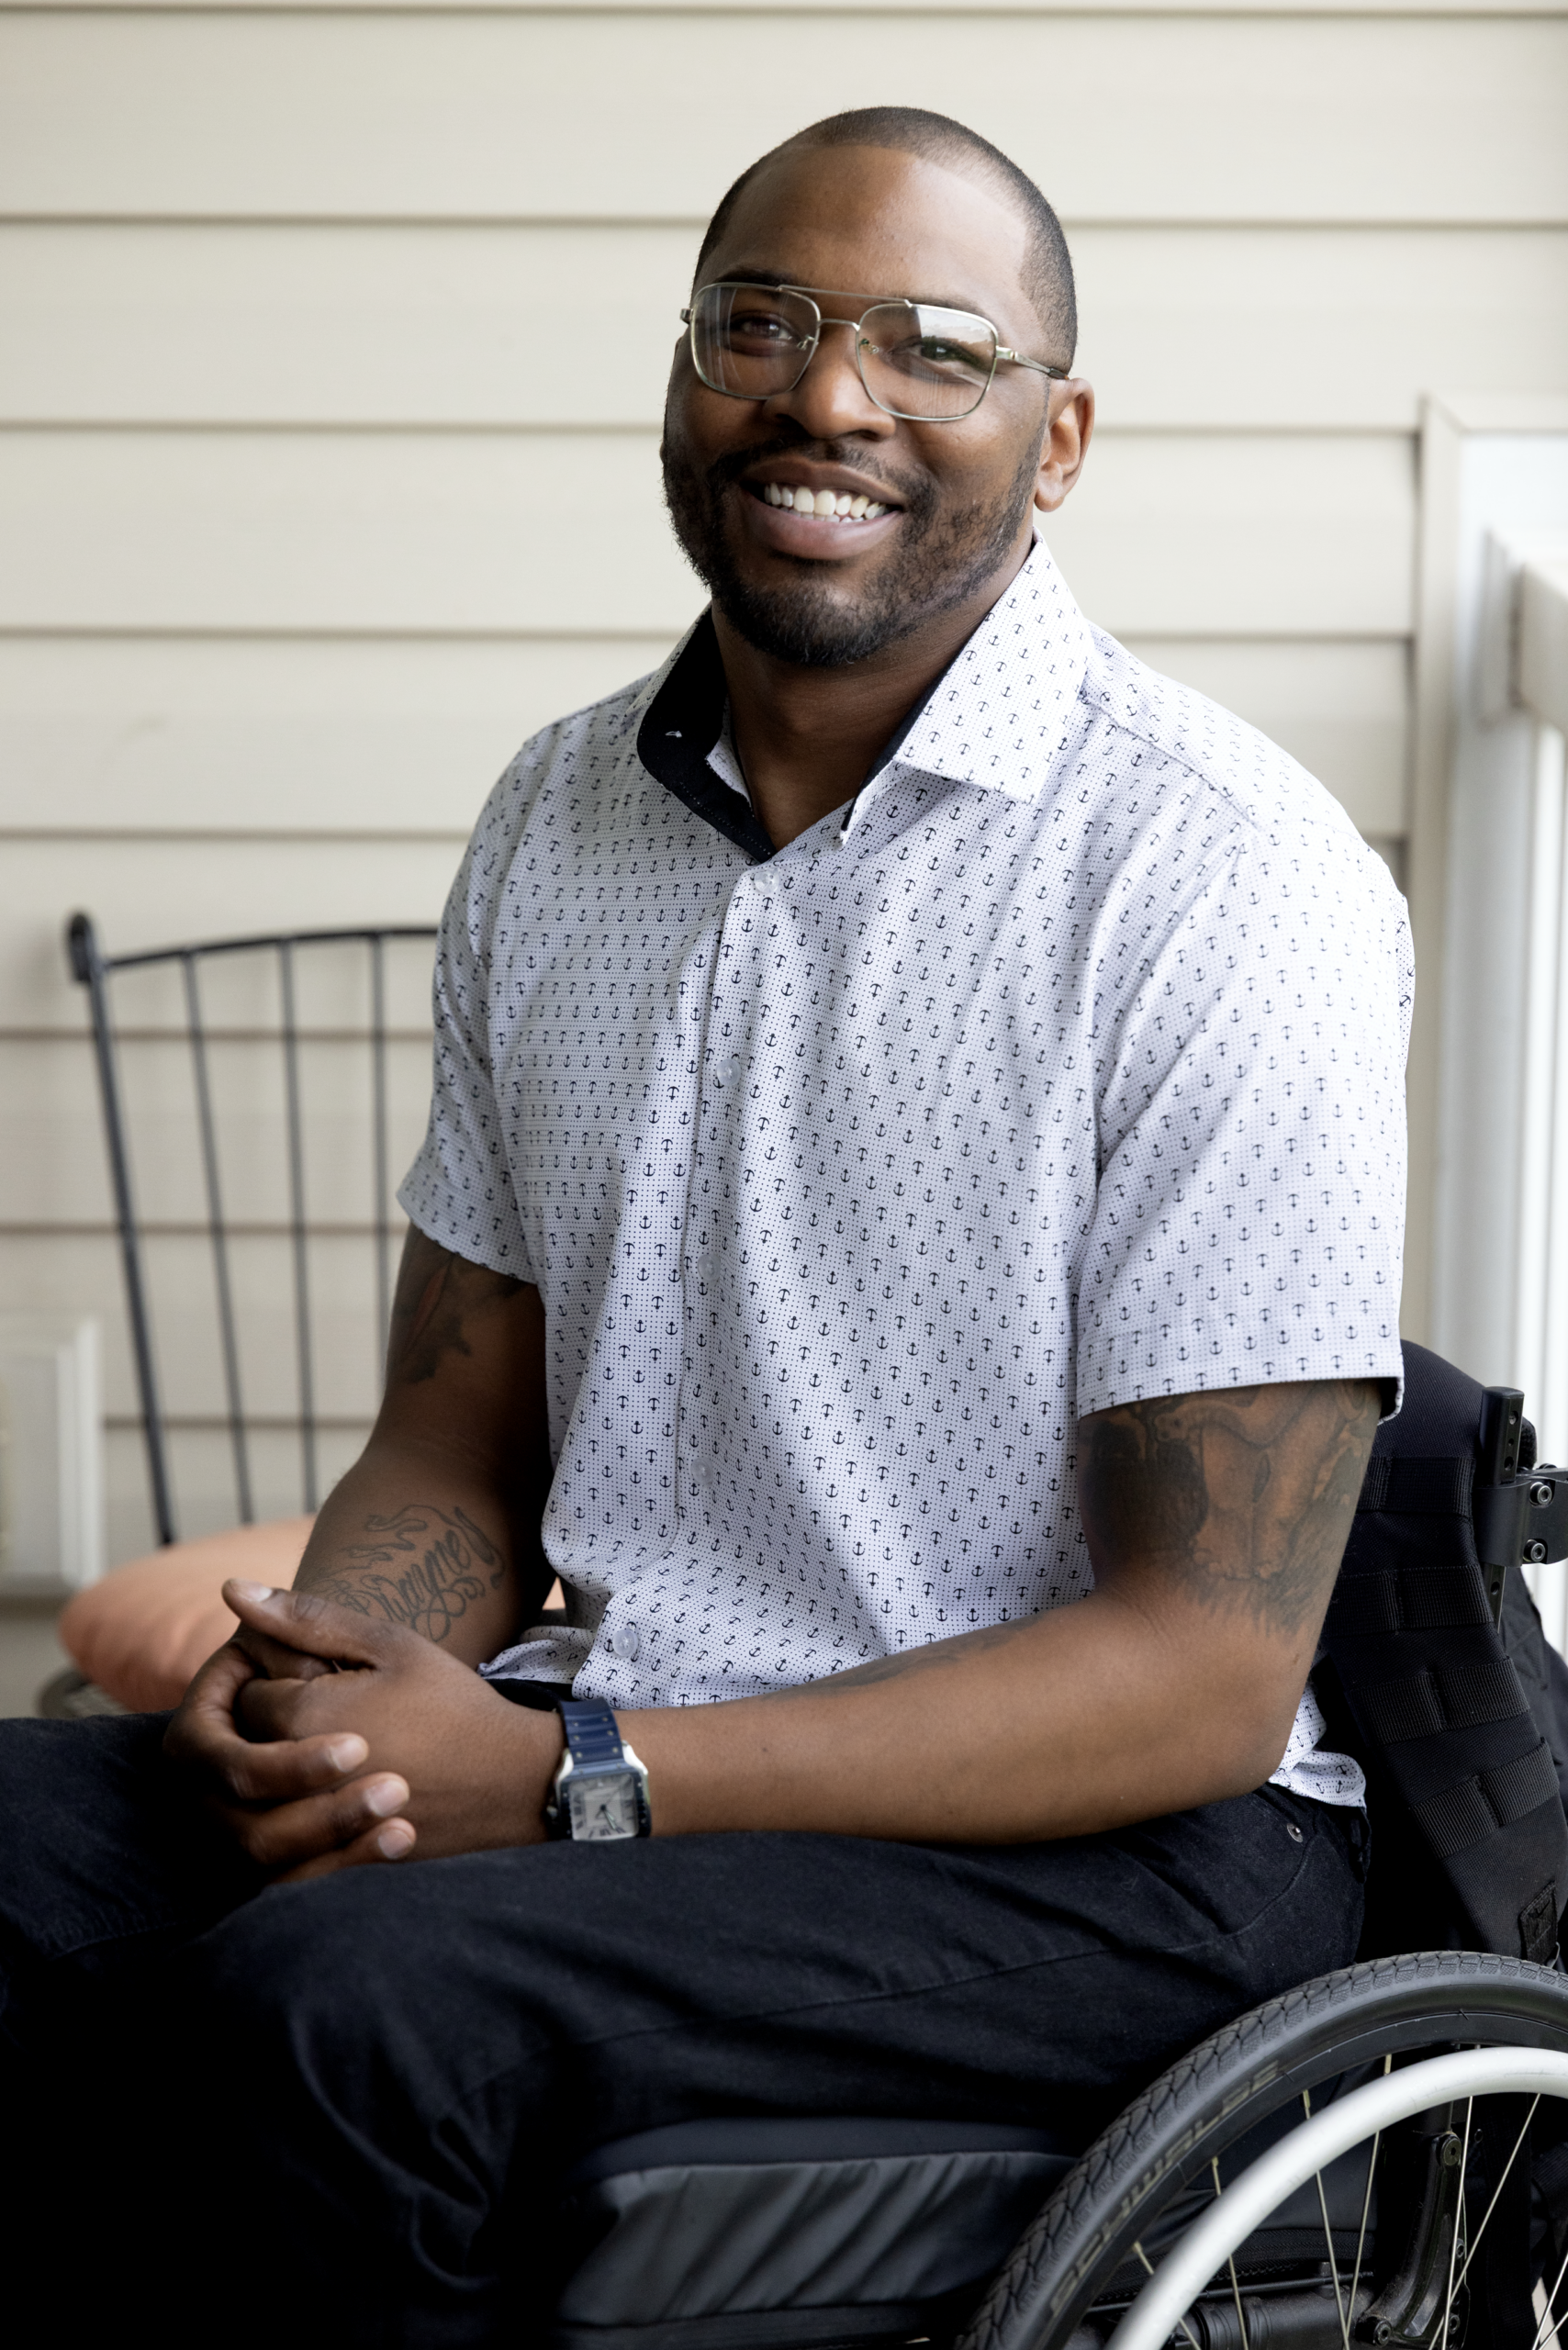
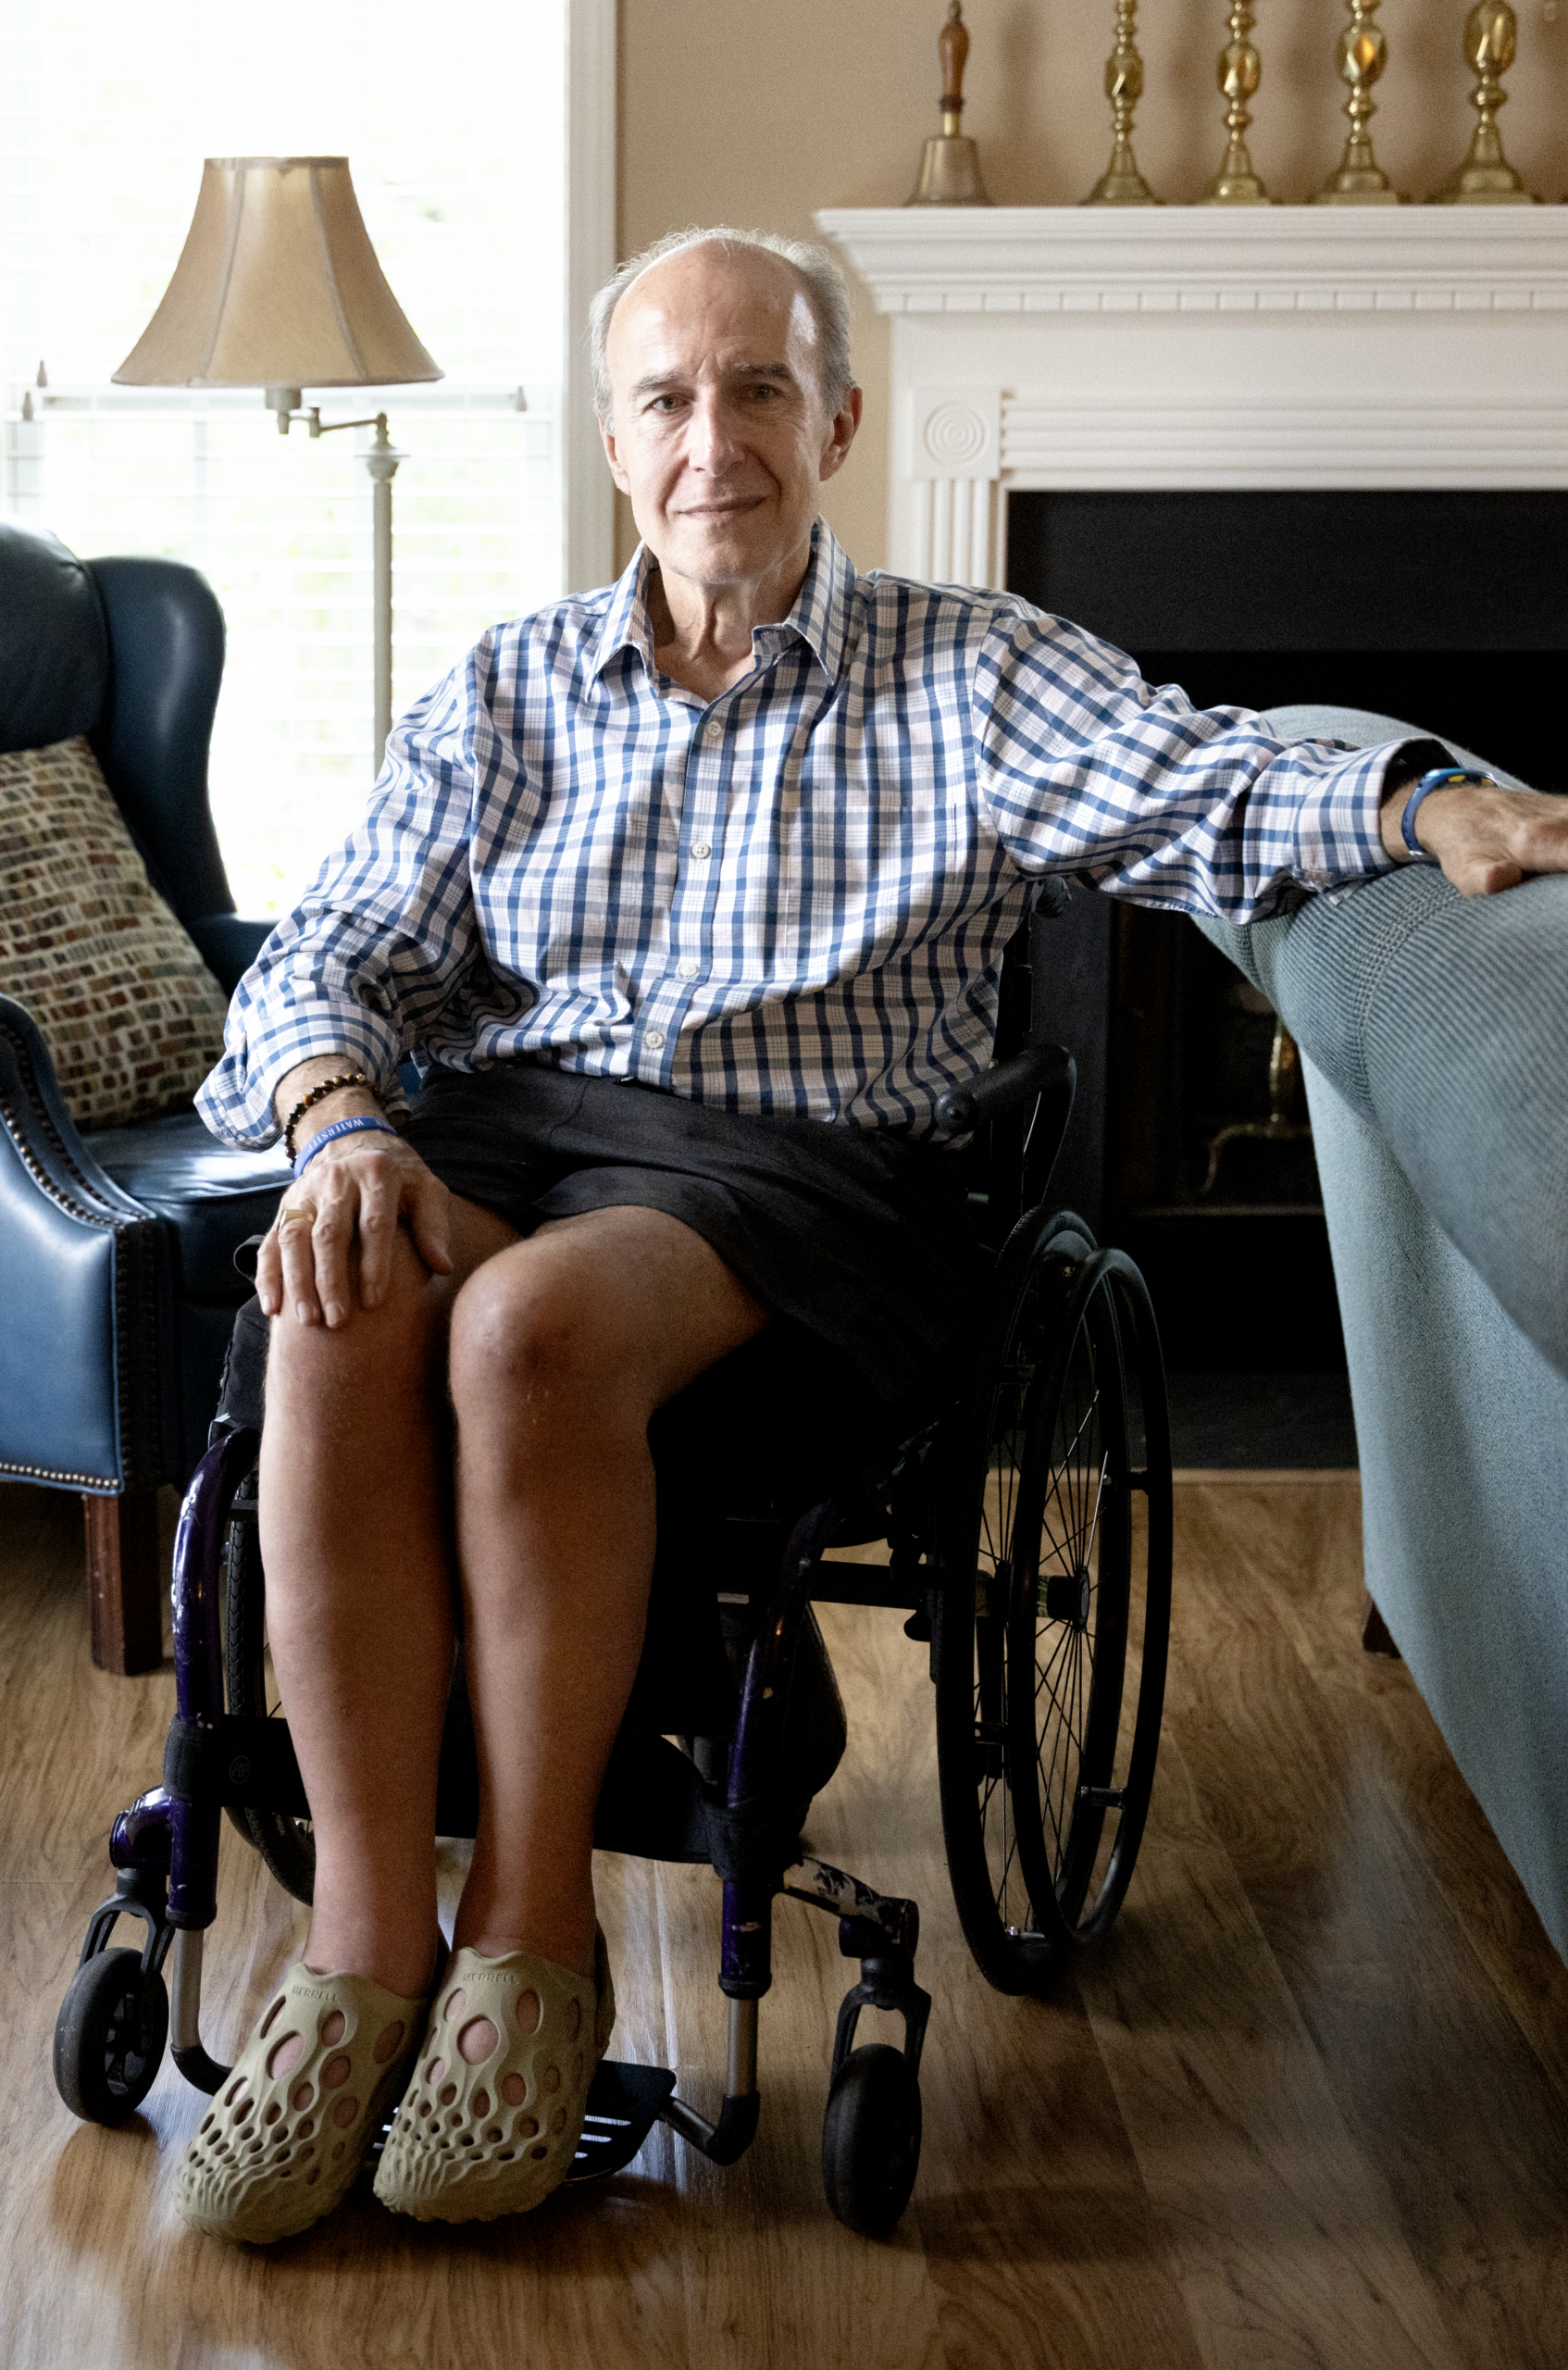
These are the kinds of voices you’ll encounter here. They’ve struggled through the accessible housing gap and are living resiliently in spite of the disabling infrastructures we continue to create. The story of (in)accessible housing is about them, but it’s also about us as a city and society.
(In)accessible housing is a major social determinant of health. Safe, affordable, stable, and suitable housing enables individuals to lead healthy, productive lives and contributes to stronger, more resilient communities.
People with disabilities living in ACCESSIBLE HOUSING experience: [Todd – can these bullet lists be single spaced?]
- Less depression
- Fewer injuries
- Lower rates of mortality
As well as:
- Greater independence
- Higher self-confidence
- More community participation
INACCESSIBLE HOUSING:
- increases fall risk
- contributes to poor health outcomes
- Increases costs of healthcare
- Increases nursing home institutionalization
Kentucky ranks among the states with the highest fall rates.
Unintentional falls cost healthcare providers $80 Billion in 2020
[Todd – not sure why the Heading6 in this section changed the font but nowhere else. I think it’s too small]
What Do We Mean by Accessible Housing

Gathering Strength’s report focuses on wheelchair accessibility because households with a wheelchair-user are the most clearly defined and documented population for whom relatively established housing standards exist.
Accessible housing in our report includes:
- One zero-step entry
- Adequate clearance at doorways and throughout
- An accessible bathroom and bedroom at grade level
- An accessible kitchen.
Download the report for details on wheelchair accessibility.
Disability is not evenly distributed
Disability in Louisville is not evenly distributed across the population.
The rate of physical disability is approximately 30% higher among Black residents than for the overall population.
Download the report for more data and graphs showing the intersection of disability, age, income, housing status, and race.


Disability, age, income, and race intersect geographically in Louisville, creating concentrated areas of housing and health inequity.
Disability rates vary widely across Louisville’s neighborhoods, from a low of 2.4% in the Highlands (East of Downtown) to a high of 15.7% in neighborhoods such as Chickasaw and Shawnee (West of Downtown)
As disability rates increase with age and are compounded by economic vulnerability, racial inequities, and geographic disparities, the need for affordable, accessible housing is not only substantial but unevenly distributed across the city
Immediate Action is Needed to Increase Accessible Housing
- Build more accessible housing
- Raise minimum percentage of units required by building code
- Update the building code to more current accessibility standards
- Motivate development of more housing and exceeding accessibility requirements through funding incentives at the state and local level.
- Make sure accessible units reach people who need them
- Unit matching mechanisms in affordable multifamily housing to prioritize households that need them
- Track whether accessible units are occupied by people with disabilities
- Fund the development of accessible housing search tools.
3. Fund modifications and incentize private market
- Scale up home modification programs
- Educate and incentivize private landlords/developers.
4. Know what you have and track what you’re building
-
- Link state and local funding and permitting databases to make unit counts publicly searchable
- Improve national, state, and local disability data collection
5. Include people with disabilities in the planning and decision-making
These are only a few of the policy, advocacy, and funding actions that can be taken immediately to reduce the accessible housing gap.
Download the report to learn more about future areas of inquiry and policy action.
Acknowledgements
The accessible housing gap report was created through a collaboration with the Community Foundation of Louisville’s Data and Policy Center.

The accessible housing gap report was funded by the Robert Wood Johnson Foundation’s Local Data for Equitable Communities grant.
